

Product Concept and Design: Overview
The Pain Point:
The landscape for Asset Managers and Financial Advisors is evolving and becoming more challenging and competitive than ever before. The need to create value, reduce costs, and demonstrate value is crucial in order to compete.
Further, the current methods of sharing reports with existing and potential clients are difficult to understand, not necessarily insightful, and, typically, visually unattractive. This heavily influences the fact that a very large percentage of investors do not trust their advisors.
Our Solution:
Viziphi is a data visualization dashboard that empowers Financial Portfolio Asset Managers to make better asset allocation decisions and achieve deeper insights into relative risk. Proprietary quant technology and simplified UX/UI let the user focus on the task of discovering asset allocation insights and showing the value to their decisions to clients. This greatly improves the asset manager's ability to increase sales and retain existing clients.
Monetization Strategy:
The product is free to users that create less than 3 analysis. When the user pays a recurring monthly cost, the amount of saved analyses is unlimited and additional sharing capabilities and time specific analyses are available.
At the point of portfolio creation, funds and ETFs can buy limited placement that surfaces based on user-types and keywords.
Access to API

Watch an overview of the interactive experience of Viziphi:

I was one of the two initial founders of Visualize Wealth and what became Viziphi. I was responsible for creating the entire UI, UX, brand, and marketing design in collaboration with my partner, Benjamin Gross, who was the CEO and real brains behind the startup.
The Core Team:
Benjamin Gross - Founder/CEO
Olof Johansson - Chief Officer of Technology
Peter Stratton - Application Architect
Eric Tomlinson - Principal Designer
Ideas become real: Concept and Discovery
Like many startups, Viziphi was birthed in a coffee shop by a couple of guys sharing their passion for ways to change the world, particularly how we could help democratize finance. I was moved by Ben’s passion and knowledge on the subject and how good design could make a real difference. We began sketching out concepts and realized we were on to something.
From that initial brainstorm, we spent the next few months utilizing an end to end, user-focused process to begin exploring, researching, and concepting new ways to surface insightful financial information in a way that our target users would find highly intuitive. Since this was the meat of the app, the kinds of visualizations and data strategies that would create value were developed first.

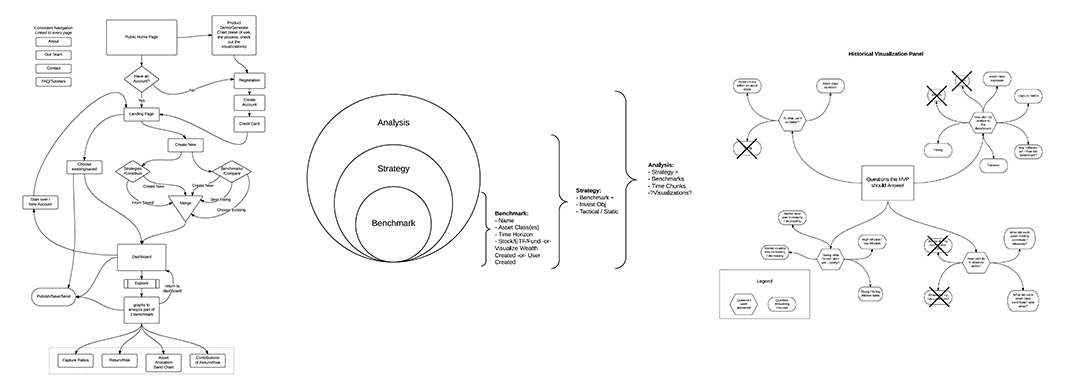
Then, we focused on making the experience and navigation of the dashboard as elegant and useful as possible to support, rather than distract from, the robust data visualizations. Our mission statement and working hypothesis was that through clean and elegant design supported by solid statistical analysis, more effective insights would be achieved and effectively communicated to stakeholders.
There’s a really amazing story to be told about how we evolved as a team and a business, but this case study is primary focused on the design details. To learn more about the story of Viziphi, feel free to reach out and let’s have a conversation!
DATA Wants to be VISUALIZed
Price Chart: This chart is similar to many price charts but differs in the amount of robust interactivity and information it provides. Primarily, the user can set the blue scrubber at the bottom of the chart to set a comparison date for the entire dashboard. At the top, the user can compare benchmarks for asset classes or model portfolios against (vs.) assets or asset classes. The grey triangles at the top of the chart indicate significant historical events that may have impacted performance, allowing the user to "scrub" to these dates to uncover significant insights throughout the dashboard for how their assets performed under the stresses of these events.


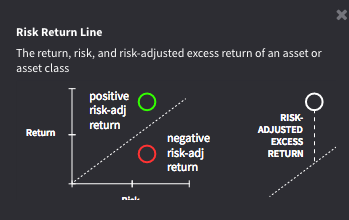
Risk and Return: This chart shows a comparative view between assets or asset classes (and comparative dates) for risk, return, and risk adjusted excess return (how much return your investment has made relative to the amount of risk the investment has taken over a given period of time, which is widely used as a measure of the value added by the portfolio or investment manager).

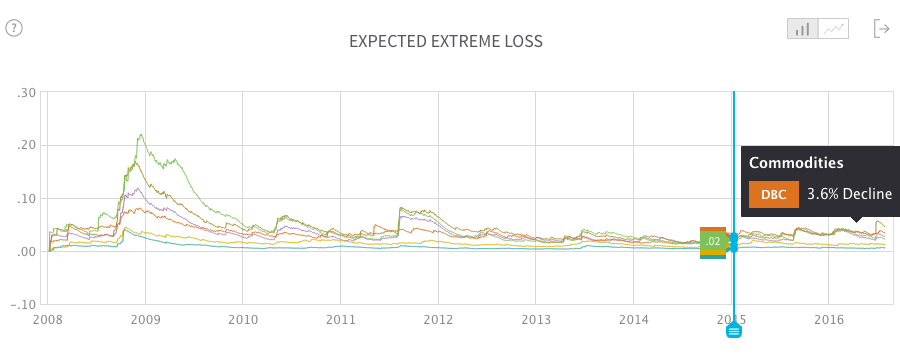
Expected Extreme Loss: One of the most valuable pieces of information we can understand on a day-to-day basis is the sources of risk within our portfolio. This chart demonstrates what an asset or asset class could be expected to lose in a worse case scenario, given the most current information. This chart can toggle between a date comparison bar chart or a timeline. The timeline features a scrubber so the asset manager can reset the entire dashboard to an area of interest, allowing deeper insights related to risk and loss to become clearer.


The Contribution to Extreme Loss: Since assets move in tandem - also known as their covariation - when looking at portfolio risk, using some measure of co-movement to understand how each asset contributes to aggregate risk is not just important, it's imperative. This chart shows how an asset or asset class's risk and co-movement could impact the entire portfolio. The timeline toggle features a scrubber so the asset manager can reset the entire dashboard to an area of interest, allowing deeper insights to become clearer.


Click here to read an excellent article by Viziphi founder Benjamin Gross that clearly illustrates the value of these Extreme Loss charts related to rebalancing a portfolio.
Performance Relative to Up Markets and Down Markets:This chart illustrates the performance of assets or asset classes in rising/up markets and falling/down markets. Unlike most charts that attempt to demonstrate this information, this iteration allows for an easy historical side-by-side comparison of the data that makes it easier to gain useful insights.


Asset Diversification: This chart indicates the available diversification when using the assets or asset classes set in the analysis, set on a value between 0 (no diversification) and 1 (complete diversification).


Asset Correlation: This chart measures the relationship between the changes of two assets or asset classes' dependence/correlation in time. The user must toggle to the dashboard's comparison date to compare assets for that date, since this chart is comparing assets in a given time.


Synergy and Control: The Dashboard Features
Fonts: Source Sans Pro for its versatility, legibility, and style.
Colors: A large color palette was required with color tones that would work well together and stand out but not overwhelm the screen. Extensive research was put into color options that supported these requirements. A branded light blue was reserved exclusively for interactive UI elements.

Top Toolbar: The toolbar at the top is a sticky element for high-level tasks such as creating and setting the analysis, setting comparison dates, and a quick-view reference for portfolio asset allocation.

Create Analysis Button: Here, the user can quickly choose between benchmarks provided by Viziphi, choose a previously created custom analysis, or start a new custom analysis.

Compare Dates: It's often useful or even necessary to compare dates for benchmark performance. Standard comparison dates are easily accessed in the drop menu. The user can also use the scrubber in the prices to set more specific dates.

Creating a Custom Analysis: Many times, users will want to construct their own custom analysis using specific assets and asset classes. Users would also want to save these analyses, so they can be reviewed, adjusted, and/or shared later. Viziphi makes this process super easy.


Creating an analysis is fool-proof with a search-as-you-type feature that automatically splits up the percentage.

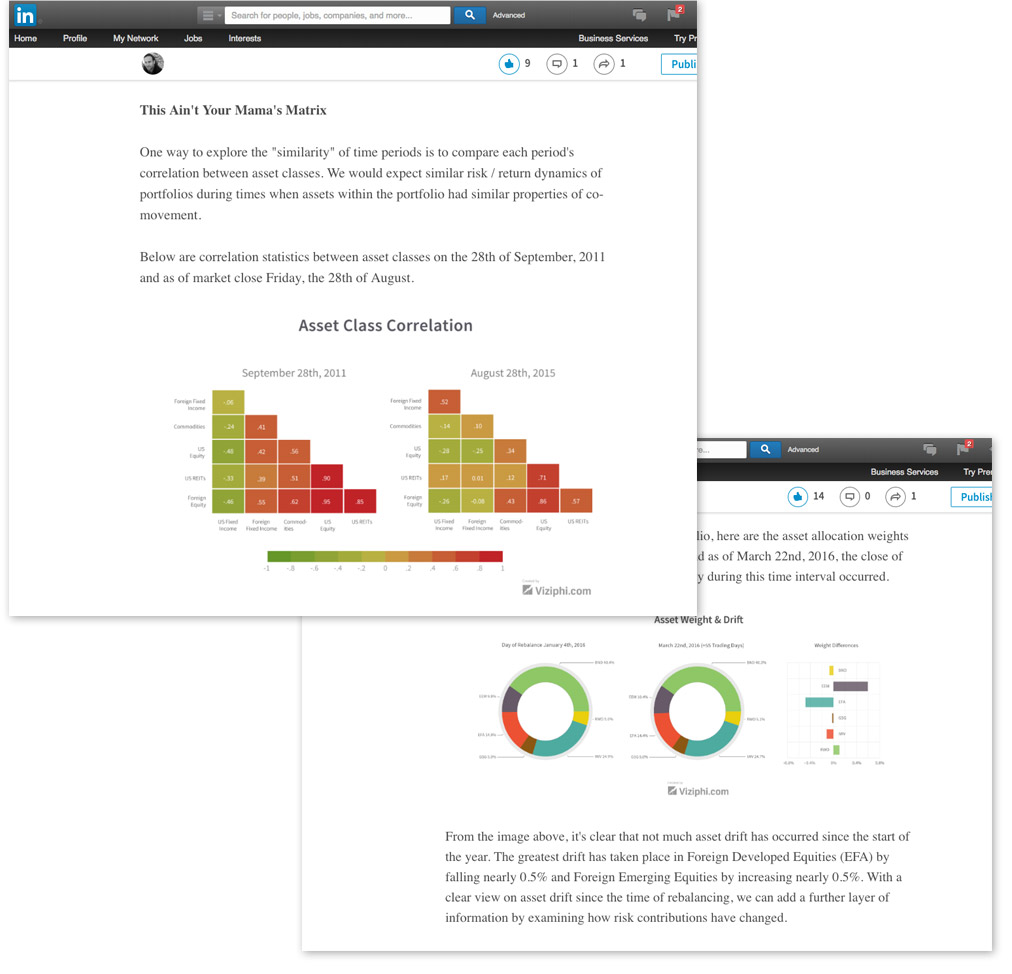
We’re really here To Share the insights
One of the most important features that Viziphi offers is the ability to share insights with colleagues, clients, and/or an audience.

The visualizations are incredibly valuable in presentations, reports, and financial articles.
Product visual Branding
Intelligent • reliable • insightful

Marketing Site
The art and copy of the marketing site was designed to leverage messaging and calls-to-action that validate assumptions around the best way to communicate with the target customer. A/B testing was conducted with the headlines CTA text that was refined for an effort to drive interest for early "alpha" access to the product. A blog and social media was used to create awareness of the efficacy of the product and to demonstrate the value of integrating Viziphi into a daily workflow.

